GGobi: Examples of Programmatic Plot Layout
See also RRGobi.tex.
First, we create a few plot descriptions which we
can put into different display windows.
plot4 <- ashDescription("tars2")
plot5 <- scatmatrixDescription("tars1", "tars2", "head")
plot6 <- parallelCoordDescription("tars1", "tars2", "head")
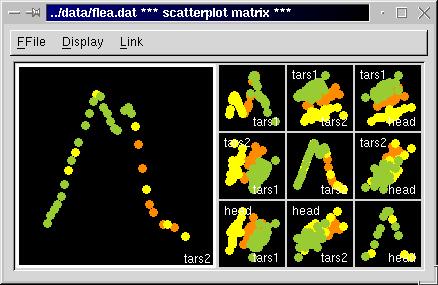
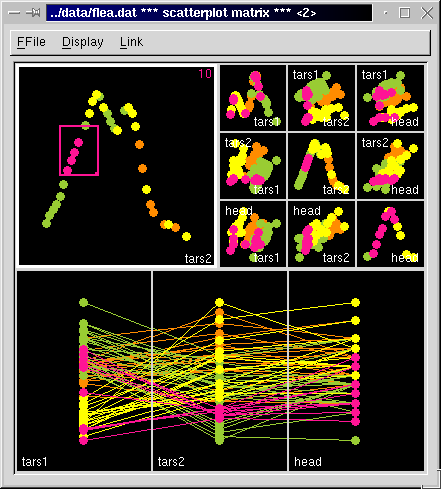
A Multi-column Layout
cl <- gtkCells(2,2)[-3,]
cl[3,1] <- 1
plotLayout(plot4, plot5, plot6,

           mfrow=c(2,2), cells=t(cl))
|
 |
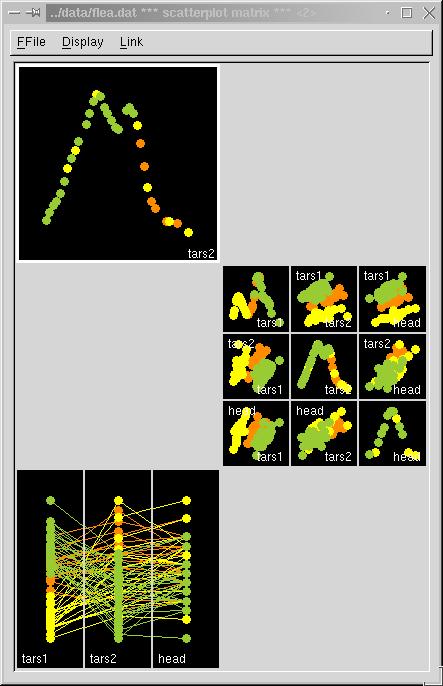
A Simple Mixed Plot Type
Specifying Individual Cell Positions
This shows how we can leave cells blank
and locate the individual plots.
plotLayout(plot4, plot5, plot6,

 mfrow=c(3,2),

 cells=t(gtkCells(3,2)[c(1,4,5),]))
|
|
Duncan Temple Lang
<duncan@research.bell-labs.com>
Last modified: Sun Nov 5 11:55:04 EST 2000