|
| | QCPGraph (QCPAxis *keyAxis, QCPAxis *valueAxis) |
| |
| virtual | ~QCPGraph () |
| |
QSharedPointer
< QCPGraphDataContainer > | data () const |
| |
| LineStyle | lineStyle () const |
| |
| QCPScatterStyle | scatterStyle () const |
| |
| int | scatterSkip () const |
| |
| QCPGraph * | channelFillGraph () const |
| |
| bool | adaptiveSampling () const |
| |
| void | setData (QSharedPointer< QCPGraphDataContainer > data) |
| |
| void | setData (const QVector< double > &keys, const QVector< double > &values, bool alreadySorted=false) |
| |
| void | setLineStyle (LineStyle ls) |
| |
| void | setScatterStyle (const QCPScatterStyle &style) |
| |
| void | setScatterSkip (int skip) |
| |
| void | setChannelFillGraph (QCPGraph *targetGraph) |
| |
| void | setAdaptiveSampling (bool enabled) |
| |
| void | addData (const QVector< double > &keys, const QVector< double > &values, bool alreadySorted=false) |
| |
| void | addData (double key, double value) |
| |
| virtual double | selectTest (const QPointF &pos, bool onlySelectable, QVariant *details=0) const Q_DECL_OVERRIDE |
| |
| virtual QCPRange | getKeyRange (bool &foundRange, QCP::SignDomain inSignDomain=QCP::sdBoth) const Q_DECL_OVERRIDE |
| |
| virtual QCPRange | getValueRange (bool &foundRange, QCP::SignDomain inSignDomain=QCP::sdBoth, const QCPRange &inKeyRange=QCPRange()) const Q_DECL_OVERRIDE |
| |
| | QCPAbstractPlottable1D (QCPAxis *keyAxis, QCPAxis *valueAxis) |
| |
| | QCPAbstractPlottable1D (QCPAxis *keyAxis, QCPAxis *valueAxis) |
| |
| | QCPAbstractPlottable1D (QCPAxis *keyAxis, QCPAxis *valueAxis) |
| |
| | QCPAbstractPlottable1D (QCPAxis *keyAxis, QCPAxis *valueAxis) |
| |
| | QCPAbstractPlottable1D (QCPAxis *keyAxis, QCPAxis *valueAxis) |
| |
| virtual | ~QCPAbstractPlottable1D () |
| |
| virtual | ~QCPAbstractPlottable1D () |
| |
| virtual | ~QCPAbstractPlottable1D () |
| |
| virtual | ~QCPAbstractPlottable1D () |
| |
| virtual | ~QCPAbstractPlottable1D () |
| |
| virtual int | dataCount () const Q_DECL_OVERRIDE |
| |
| virtual int | dataCount () const Q_DECL_OVERRIDE |
| |
| virtual int | dataCount () const Q_DECL_OVERRIDE |
| |
| virtual int | dataCount () const Q_DECL_OVERRIDE |
| |
| virtual int | dataCount () const Q_DECL_OVERRIDE |
| |
| virtual double | dataMainKey (int index) const Q_DECL_OVERRIDE |
| |
| virtual double | dataMainKey (int index) const Q_DECL_OVERRIDE |
| |
| virtual double | dataMainKey (int index) const Q_DECL_OVERRIDE |
| |
| virtual double | dataMainKey (int index) const Q_DECL_OVERRIDE |
| |
| virtual double | dataMainKey (int index) const Q_DECL_OVERRIDE |
| |
| virtual double | dataSortKey (int index) const Q_DECL_OVERRIDE |
| |
| virtual double | dataSortKey (int index) const Q_DECL_OVERRIDE |
| |
| virtual double | dataSortKey (int index) const Q_DECL_OVERRIDE |
| |
| virtual double | dataSortKey (int index) const Q_DECL_OVERRIDE |
| |
| virtual double | dataSortKey (int index) const Q_DECL_OVERRIDE |
| |
| virtual double | dataMainValue (int index) const Q_DECL_OVERRIDE |
| |
| virtual double | dataMainValue (int index) const Q_DECL_OVERRIDE |
| |
| virtual double | dataMainValue (int index) const Q_DECL_OVERRIDE |
| |
| virtual double | dataMainValue (int index) const Q_DECL_OVERRIDE |
| |
| virtual double | dataMainValue (int index) const Q_DECL_OVERRIDE |
| |
| virtual QCPRange | dataValueRange (int index) const Q_DECL_OVERRIDE |
| |
| virtual QCPRange | dataValueRange (int index) const Q_DECL_OVERRIDE |
| |
| virtual QCPRange | dataValueRange (int index) const Q_DECL_OVERRIDE |
| |
| virtual QCPRange | dataValueRange (int index) const Q_DECL_OVERRIDE |
| |
| virtual QCPRange | dataValueRange (int index) const Q_DECL_OVERRIDE |
| |
| virtual QPointF | dataPixelPosition (int index) const Q_DECL_OVERRIDE |
| |
| virtual QPointF | dataPixelPosition (int index) const Q_DECL_OVERRIDE |
| |
| virtual QPointF | dataPixelPosition (int index) const Q_DECL_OVERRIDE |
| |
| virtual QPointF | dataPixelPosition (int index) const Q_DECL_OVERRIDE |
| |
| virtual QPointF | dataPixelPosition (int index) const Q_DECL_OVERRIDE |
| |
| virtual bool | sortKeyIsMainKey () const Q_DECL_OVERRIDE |
| |
| virtual bool | sortKeyIsMainKey () const Q_DECL_OVERRIDE |
| |
| virtual bool | sortKeyIsMainKey () const Q_DECL_OVERRIDE |
| |
| virtual bool | sortKeyIsMainKey () const Q_DECL_OVERRIDE |
| |
| virtual bool | sortKeyIsMainKey () const Q_DECL_OVERRIDE |
| |
| virtual QCPDataSelection | selectTestRect (const QRectF &rect, bool onlySelectable) const Q_DECL_OVERRIDE |
| |
| virtual QCPDataSelection | selectTestRect (const QRectF &rect, bool onlySelectable) const Q_DECL_OVERRIDE |
| |
| virtual QCPDataSelection | selectTestRect (const QRectF &rect, bool onlySelectable) const Q_DECL_OVERRIDE |
| |
| virtual QCPDataSelection | selectTestRect (const QRectF &rect, bool onlySelectable) const Q_DECL_OVERRIDE |
| |
| virtual QCPDataSelection | selectTestRect (const QRectF &rect, bool onlySelectable) const Q_DECL_OVERRIDE |
| |
| virtual int | findBegin (double sortKey, bool expandedRange=true) const Q_DECL_OVERRIDE |
| |
| virtual int | findBegin (double sortKey, bool expandedRange=true) const Q_DECL_OVERRIDE |
| |
| virtual int | findBegin (double sortKey, bool expandedRange=true) const Q_DECL_OVERRIDE |
| |
| virtual int | findBegin (double sortKey, bool expandedRange=true) const Q_DECL_OVERRIDE |
| |
| virtual int | findBegin (double sortKey, bool expandedRange=true) const Q_DECL_OVERRIDE |
| |
| virtual int | findEnd (double sortKey, bool expandedRange=true) const Q_DECL_OVERRIDE |
| |
| virtual int | findEnd (double sortKey, bool expandedRange=true) const Q_DECL_OVERRIDE |
| |
| virtual int | findEnd (double sortKey, bool expandedRange=true) const Q_DECL_OVERRIDE |
| |
| virtual int | findEnd (double sortKey, bool expandedRange=true) const Q_DECL_OVERRIDE |
| |
| virtual int | findEnd (double sortKey, bool expandedRange=true) const Q_DECL_OVERRIDE |
| |
| virtual QCPPlottableInterface1D * | interface1D () Q_DECL_OVERRIDE |
| |
| virtual QCPPlottableInterface1D * | interface1D () Q_DECL_OVERRIDE |
| |
| virtual QCPPlottableInterface1D * | interface1D () Q_DECL_OVERRIDE |
| |
| virtual QCPPlottableInterface1D * | interface1D () Q_DECL_OVERRIDE |
| |
| virtual QCPPlottableInterface1D * | interface1D () Q_DECL_OVERRIDE |
| |
| | QCPAbstractPlottable (QCPAxis *keyAxis, QCPAxis *valueAxis) |
| |
| virtual | ~QCPAbstractPlottable () |
| |
| QString | name () const |
| |
| bool | antialiasedFill () const |
| |
| bool | antialiasedScatters () const |
| |
| QPen | pen () const |
| |
| QBrush | brush () const |
| |
| QCPAxis * | keyAxis () const |
| |
| QCPAxis * | valueAxis () const |
| |
| QCP::SelectionType | selectable () const |
| |
| bool | selected () const |
| |
| QCPDataSelection | selection () const |
| |
| QCPSelectionDecorator * | selectionDecorator () const |
| |
| void | setName (const QString &name) |
| |
| void | setAntialiasedFill (bool enabled) |
| |
| void | setAntialiasedScatters (bool enabled) |
| |
| void | setPen (const QPen &pen) |
| |
| void | setBrush (const QBrush &brush) |
| |
| void | setKeyAxis (QCPAxis *axis) |
| |
| void | setValueAxis (QCPAxis *axis) |
| |
| Q_SLOT void | setSelectable (QCP::SelectionType selectable) |
| |
| Q_SLOT void | setSelection (QCPDataSelection selection) |
| |
| void | setSelectionDecorator (QCPSelectionDecorator *decorator) |
| |
| void | coordsToPixels (double key, double value, double &x, double &y) const |
| |
| const QPointF | coordsToPixels (double key, double value) const |
| |
| void | pixelsToCoords (double x, double y, double &key, double &value) const |
| |
| void | pixelsToCoords (const QPointF &pixelPos, double &key, double &value) const |
| |
| void | rescaleAxes (bool onlyEnlarge=false) const |
| |
| void | rescaleKeyAxis (bool onlyEnlarge=false) const |
| |
| void | rescaleValueAxis (bool onlyEnlarge=false, bool inKeyRange=false) const |
| |
| bool | addToLegend (QCPLegend *legend) |
| |
| bool | addToLegend () |
| |
| bool | removeFromLegend (QCPLegend *legend) const |
| |
| bool | removeFromLegend () const |
| |
| | QCPLayerable (QCustomPlot *plot, QString targetLayer=QString(), QCPLayerable *parentLayerable=0) |
| |
| virtual | ~QCPLayerable () |
| |
| bool | visible () const |
| |
| QCustomPlot * | parentPlot () const |
| |
| QCPLayerable * | parentLayerable () const |
| |
| QCPLayer * | layer () const |
| |
| bool | antialiased () const |
| |
| void | setVisible (bool on) |
| |
| Q_SLOT bool | setLayer (QCPLayer *layer) |
| |
| bool | setLayer (const QString &layerName) |
| |
| void | setAntialiased (bool enabled) |
| |
| bool | realVisibility () const |
| |
| virtual | ~QCPPlottableInterface1D () |
| |
| virtual | ~QCPPlottableInterface1D () |
| |
| virtual | ~QCPPlottableInterface1D () |
| |
| virtual | ~QCPPlottableInterface1D () |
| |
| virtual | ~QCPPlottableInterface1D () |
| |
|
| virtual void | draw (QCPPainter *painter) Q_DECL_OVERRIDE |
| |
| virtual void | drawLegendIcon (QCPPainter *painter, const QRectF &rect) const Q_DECL_OVERRIDE |
| |
| virtual void | drawFill (QCPPainter *painter, QVector< QPointF > *lines) const |
| |
| virtual void | drawScatterPlot (QCPPainter *painter, const QVector< QPointF > &scatters, const QCPScatterStyle &style) const |
| |
| virtual void | drawLinePlot (QCPPainter *painter, const QVector< QPointF > &lines) const |
| |
| virtual void | drawImpulsePlot (QCPPainter *painter, const QVector< QPointF > &lines) const |
| |
| virtual void | getOptimizedLineData (QVector< QCPGraphData > *lineData, const QCPGraphDataContainer::const_iterator &begin, const QCPGraphDataContainer::const_iterator &end) const |
| |
| virtual void | getOptimizedScatterData (QVector< QCPGraphData > *scatterData, QCPGraphDataContainer::const_iterator begin, QCPGraphDataContainer::const_iterator end) const |
| |
| void | getVisibleDataBounds (QCPGraphDataContainer::const_iterator &begin, QCPGraphDataContainer::const_iterator &end, const QCPDataRange &rangeRestriction) const |
| |
| void | getLines (QVector< QPointF > *lines, const QCPDataRange &dataRange) const |
| |
| void | getScatters (QVector< QPointF > *scatters, const QCPDataRange &dataRange) const |
| |
| QVector< QPointF > | dataToLines (const QVector< QCPGraphData > &data) const |
| |
| QVector< QPointF > | dataToStepLeftLines (const QVector< QCPGraphData > &data) const |
| |
| QVector< QPointF > | dataToStepRightLines (const QVector< QCPGraphData > &data) const |
| |
| QVector< QPointF > | dataToStepCenterLines (const QVector< QCPGraphData > &data) const |
| |
| QVector< QPointF > | dataToImpulseLines (const QVector< QCPGraphData > &data) const |
| |
| QVector< QCPDataRange > | getNonNanSegments (const QVector< QPointF > *lineData, Qt::Orientation keyOrientation) const |
| |
QVector< QPair< QCPDataRange,
QCPDataRange > > | getOverlappingSegments (QVector< QCPDataRange > thisSegments, const QVector< QPointF > *thisData, QVector< QCPDataRange > otherSegments, const QVector< QPointF > *otherData) const |
| |
| bool | segmentsIntersect (double aLower, double aUpper, double bLower, double bUpper, int &bPrecedence) const |
| |
| QPointF | getFillBasePoint (QPointF matchingDataPoint) const |
| |
| const QPolygonF | getFillPolygon (const QVector< QPointF > *lineData, QCPDataRange segment) const |
| |
| const QPolygonF | getChannelFillPolygon (const QVector< QPointF > *lineData, QCPDataRange thisSegment, const QVector< QPointF > *otherData, QCPDataRange otherSegment) const |
| |
| int | findIndexBelowX (const QVector< QPointF > *data, double x) const |
| |
| int | findIndexAboveX (const QVector< QPointF > *data, double x) const |
| |
| int | findIndexBelowY (const QVector< QPointF > *data, double y) const |
| |
| int | findIndexAboveY (const QVector< QPointF > *data, double y) const |
| |
| double | pointDistance (const QPointF &pixelPoint, QCPGraphDataContainer::const_iterator &closestData) const |
| |
| void | getDataSegments (QList< QCPDataRange > &selectedSegments, QList< QCPDataRange > &unselectedSegments) const |
| |
| void | getDataSegments (QList< QCPDataRange > &selectedSegments, QList< QCPDataRange > &unselectedSegments) const |
| |
| void | getDataSegments (QList< QCPDataRange > &selectedSegments, QList< QCPDataRange > &unselectedSegments) const |
| |
| void | getDataSegments (QList< QCPDataRange > &selectedSegments, QList< QCPDataRange > &unselectedSegments) const |
| |
| void | getDataSegments (QList< QCPDataRange > &selectedSegments, QList< QCPDataRange > &unselectedSegments) const |
| |
| void | drawPolyline (QCPPainter *painter, const QVector< QPointF > &lineData) const |
| |
| void | drawPolyline (QCPPainter *painter, const QVector< QPointF > &lineData) const |
| |
| void | drawPolyline (QCPPainter *painter, const QVector< QPointF > &lineData) const |
| |
| void | drawPolyline (QCPPainter *painter, const QVector< QPointF > &lineData) const |
| |
| void | drawPolyline (QCPPainter *painter, const QVector< QPointF > &lineData) const |
| |
| virtual QRect | clipRect () const Q_DECL_OVERRIDE |
| |
| virtual QCP::Interaction | selectionCategory () const Q_DECL_OVERRIDE |
| |
| void | applyDefaultAntialiasingHint (QCPPainter *painter) const Q_DECL_OVERRIDE |
| |
| virtual void | selectEvent (QMouseEvent *event, bool additive, const QVariant &details, bool *selectionStateChanged) Q_DECL_OVERRIDE |
| |
| virtual void | deselectEvent (bool *selectionStateChanged) Q_DECL_OVERRIDE |
| |
| void | applyFillAntialiasingHint (QCPPainter *painter) const |
| |
| void | applyScattersAntialiasingHint (QCPPainter *painter) const |
| |
| virtual void | parentPlotInitialized (QCustomPlot *parentPlot) |
| |
| virtual void | mousePressEvent (QMouseEvent *event, const QVariant &details) |
| |
| virtual void | mouseMoveEvent (QMouseEvent *event, const QPointF &startPos) |
| |
| virtual void | mouseReleaseEvent (QMouseEvent *event, const QPointF &startPos) |
| |
| virtual void | mouseDoubleClickEvent (QMouseEvent *event, const QVariant &details) |
| |
| virtual void | wheelEvent (QWheelEvent *event) |
| |
| void | initializeParentPlot (QCustomPlot *parentPlot) |
| |
| void | setParentLayerable (QCPLayerable *parentLayerable) |
| |
| bool | moveToLayer (QCPLayer *layer, bool prepend) |
| |
| void | applyAntialiasingHint (QCPPainter *painter, bool localAntialiased, QCP::AntialiasedElement overrideElement) const |
| |
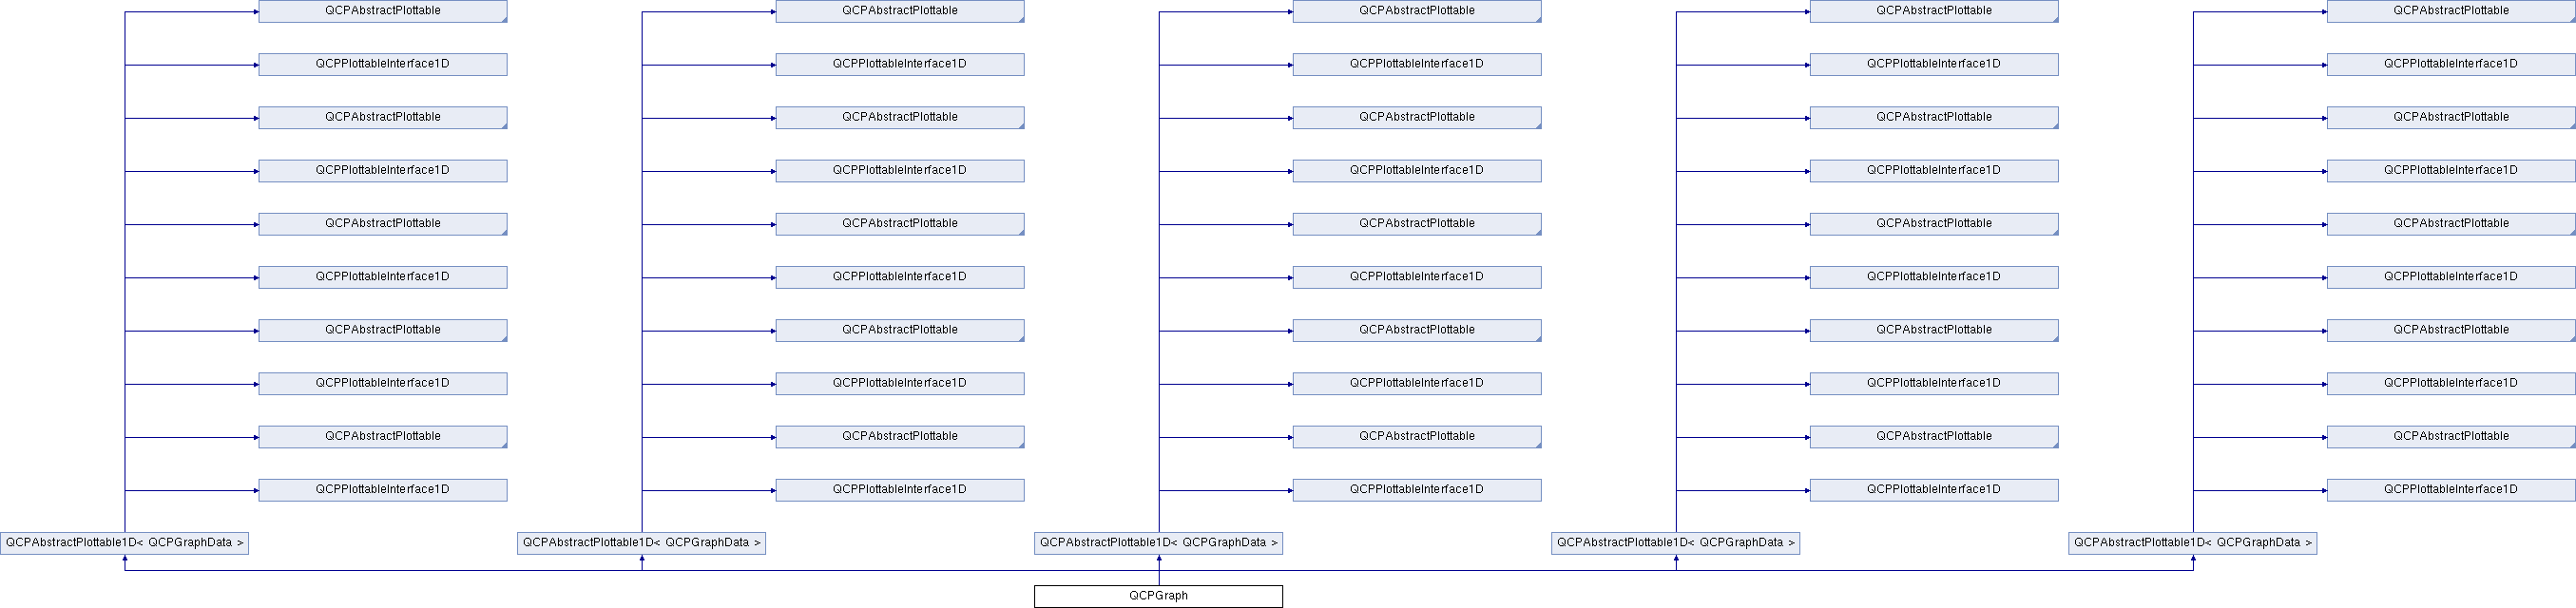
A plottable representing a graph in a plot.
Usually you create new graphs by calling QCustomPlot::addGraph. The resulting instance can be accessed via QCustomPlot::graph.
To plot data, assign it with the setData or addData functions. Alternatively, you can also access and modify the data via the data method, which returns a pointer to the internal QCPGraphDataContainer.
Graphs are used to display single-valued data. Single-valued means that there should only be one data point per unique key coordinate. In other words, the graph can't have loops. If you do want to plot non-single-valued curves, rather use the QCPCurve plottable.
Gaps in the graph line can be created by adding data points with NaN as value (qQNaN() or std::numeric_limits<double>::quiet_NaN()) in between the two data points that shall be separated.
Changing the appearance
The appearance of the graph is mainly determined by the line style, scatter style, brush and pen of the graph (setLineStyle, setScatterStyle, setBrush, setPen).
Filling under or between graphs
QCPGraph knows two types of fills: Normal graph fills towards the zero-value-line parallel to the key axis of the graph, and fills between two graphs, called channel fills. To enable a fill, just set a brush with setBrush which is neither Qt::NoBrush nor fully transparent.
By default, a normal fill towards the zero-value-line will be drawn. To set up a channel fill between this graph and another one, call setChannelFillGraph with the other graph as parameter.
- See Also
- QCustomPlot::addGraph, QCustomPlot::graph


 Protected Member Functions inherited from QCPAbstractPlottable1D< QCPGraphData >


 1.8.5
1.8.5